Content
Questions
Q: What is the impact of calibrating model waves with altimeter measurements? (A04121701)
Q: How do satellite observations used by waveclimate.com compare to wavemodel results ? (A03071501)
Q: What is the validity of the reported waveheights in shallow water ? (A01062103)
Q: Why don’t I find the highest wave periods of swell in the total wave period table ? (A01062105)
Q: How are windspeed and wind direction defined ? (A01062604)
Q: How are wave periods defined ? (A01062605)
Q: Why should I distinguish between seasons in waveclimate.com’s climate branch ? (A01070901)
Q: What is the difference between "samples" and "passes" ? (A01070902)
Q: How does waveclimate.com distinguish between wind-sea and swell ? (A01102402)
Q: How are nearshore wave- and wind parameters found ? (A02052801)
Q: How do waveheight from SAR and waveheight from altimeter relate ? (A02081401)
Q: How does waveheight from waveclimate.com relate to the standard WMO sea state scale ? (A03040101)
Q: How does windspeed from waveclimate.com relate to the standard Beaufort scale ? (A03040102)
Q: How do I find the peak period from waveclimate.com's wave period ? (A03040103)
Answers
Model wind and waves are calibrated by means of satellite measurements.
This wave model calibration is described in sections 1.4 (item 3) and 4.7 of the
model validation report.
Satellite-based calibration removes the systematic model-satellite error and also significantly reduces the sytematic error between model and buoys (as seen in table 3 of the validation document).
The impact of calibrating model waves with altimeter is illustrated by means of charts of the ratio of raw and calibrated mean significant wave height.
Satellite observations used by waveclimate.com do differ from Wavewatch III wavemodel results: the variability of (altimeter) waveheight is higher than the variability of waveheight computed by the wave model. The question is how one defines the standard for waveheight and variability of waveheight.
We think that a sensible "standard" for variability in significant wave height is a buoy measurement (averaged over about 17 minutes is most common). Model wave data are in our view not (yet) suitable as an objective standard as they are essentially "filtered" weather analyses, so their variability depends very much on the wave model settings and on the variability of the wind field data, which in term depends on the atmospheric observation density in the area, and on the weather prediction model and assimilation methods (the overall effect is strongly regionally dependent) .
Altimeter data are averaged somewhat along the track (e.g.
10 raw values in 7 km for ERS). Comparing sampling variability
of altimeter waveheight and buoy waveheights, the altimeter generally
should have a lower variability. In a crude and pessimistic analysis
assuming long-crested waves, the sampling variabilities are about
equal. The low sampling variability is also confirmed by cross-validation
of collocated wave height observations from different altimeter
missions. Other
possible errors in altimeter waveheights are mainly related to
heavy rain (practically limited to the tropics).
Models generally show less variability than buoy or altimeter measurements in particular if the driving wind fields are small scale or variable. We have made comparisons between Wavewatch III output, buoy data and altimeter data in Asia showing that a lot of real variability was missing in the model data although the overall agreement on time scales of a day or longer was good. Also the ERA-40 hindcast of ECMWF systematically underestimates extremes both on the high and the low end of the scale.
Please note that waveclimate.com calibrates Wavewatch III model
waveheight with altimeter waveheight (except for the timeseries
plot where uncalibrated model waveheight is given).
This wave model calibration is described in the validation
report of the offshore waveclimate.
Waveclimate.com offers the option (through the "data of past events"
option in the blue panel to the left) to plot timeseries of satellite
based waveheight or windspeed together with uncalibrated
model waveheight or windspeed over a period of two weeks. Preferably,
satellite observations should be taken from a 50km or 100km wide
area around the wave model gridpoint in order to make a sensible
comparison.
The offshore climate branch of waveclimate.com is representative for relatively deep water. You should use the nearshore climate branch to obtain the shallow-water wave climate. Question Q02052801 deals with the offshore to nearshore translation.
Wave period measures such as the zero-crossing period (see A01062605) are all obtained by averaging. The zero-crossing period of the swell waves will generally be larger than the zero-crossing wave period of the entire seastate (consisting of swell plus wind-sea) because the swell waves normally have longer periods than the wind-sea waves, so an average period of the swell waves will be longer than an average period of swell plus wind-sea together.
Windspeed is defined as the 1-hour averaged windspeed at 10m above the sea surface. Wind direction is nautical, i.e. 0 degrees mean wind blowing from the North and 90 degrees means wind blowing from the East.
Waveclimate.com uses three types of wave periods, peak wave period, mean wave period and zero-crossing wave period.
The peak wave period is not integrated but simply found as the reciprocal value of the spectral frequency for which the wave spectrum reaches its maximum.
The mean wave period is defined as

The zero-crossing wave period is defined as

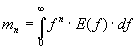
Where the n-th spectral moment mn is the
following integral over the surface wave energy spectrum E
When applied to the entire seastate (wind-sea plus swell), the mean wave period is sensitive to long waves, whereas the zero-crossing period is sensitive to short waves.
Also refer to the definition output parameters.
Season selection within waveclimate.com lets you choose
the month(s) to be extracted from the data inside the current
area or from the model point of interest.
The underlying reason for splitting up the year in distinct seasons
is that each season could be governed by different phenomena.
The quality of curve fitting, an essential part of the statistical
processing used by waveclimate.com , will increase by separating
these phenomena. The distribution of average windspeed or significant
waveheight over the months of the year
might be of assistance when you are not sure about different seasonal
phenomena.
Please be aware of the fact that, if you have selected a season, probabilities on output
will be conditional, i.e. the probabilities relate to the fraction of time within the selected season.
If you select January for example and waves are said to exceed 5m with a probability of 10%,
this means that 10% of the waves are expected to be higher than 5m
under the condition that samples were taken from January only (from consecutive years).
Alternatively, one could compute the simultaneous probability that waves become higher than 5m and
that this occurs in January. This simultaneaous probability would then approximately be equal to
one twelfth of the conditional probability.
The result pages of waveclimate.com contain the phrase "based on … samples from … passes". For example, below the scatter diagram. It is important to make a distinction between passes and samples. A pass is defined as a set of satellite observations resulting from one pass of the satellite over the area under investigation. Typically, consecutive passes over a specific area will be one and a half day apart. Passes can be considered statistically independent. Samples are the distinct satellite observations made during one such pass: they are only seconds apart in time and therefore statistically dependent.
Waveclimate.com distinguishes between a swell part and a wind-sea part of the one-dimensional wave spectrum. The wind-sea part is found as a nearly fully developed (wave age is set to 1.1) Donelan-Pearson spectrum which depends the wind speed. The swell part of the spectrum is simply the total spectrum minus this parametrized wind-sea spectrum.
For detailed information on how waveclimate.com separates wind-sea and swell, please refer to
Mastenbroek, C., Valk, C.F. de, A semiparametric algorithm
to retrieve ocean
Wave spectra from synthetic aperture radar. Journal of Geophysical
Research,
Vol. 105, No. C2, p. 3497-3516 (2000).
Answer A01070902 explains the difference between samples and passes.
Wind data in the nearshore branch of waveclimate.com is just copied from the offshore wind data (just for convenience).
Translation of offshore wave data to nearshore wave data takes the following phenomenons into account
- Wave refraction over parallel depth contours
- Shoaling by sea-bed bathymetry
- Dissipation by wave breaking
- Sheltering by islands and capes
- Dissipation by bottom friction (optional)
A detailed description of the translation of offshore wave parameters to nearshore is available as PDF document.
In order to remove inconsistencies between significant waveheight from SAR and significant waveheight from altimeter, waveclimate.com corrects the offshore SAR significant waveheight and wave period using altimeter waveheights. The correction is performed on the fly as it depends on the offshore area under investigation. Corrections of a few percent are typical. Maximum corrections for SAR waveheight and wave period are about 15% and 7% respectively.
Calibration of SAR parameters with altimeter waveheights is done on the fly by waveclimate.com. A detailed description of the calibration of SAR data is given in chapter 4 of the validation document.
Timeseries of altimeter data and calibrated SAR data can be compared over a period of 2 weeks (through the "data of past events" option in the blue panel to the left).
Sea state OCL codes are the same as those used by NODC except where a NODC code is a character value in which case OCL assigns a numeric equivalent. The NODC code is in parenthesis if different from the OCL code.
| OCL code 18 | NODC code 0109 | Description | Feet | Meters |
|---|---|---|---|---|
| 0 | -- | Calm-Glassy | 0 | 0 |
| 1 | -- | Calm-Rippled | 0-1/3 | 0-0.1 |
| 2 | -- | Smooth-Wavelet | 1/3-1 2/3 | 0.1-0.5 |
| 3 | -- | Slight | 1 2/3-4 | 0.5-1.25 |
| 4 | -- | Moderate | 4-8 | 1.25-2.5 |
| 5 | -- | Rough | 8-13 | 2.5-4 |
| 6 | -- | Very Rough | 13-20 | 4-6 |
| 7 | -- | High | 20-30 | 6-9 |
| 8 | -- | Very High | 30-45 | 9-14 |
| 9 | -- | Phenomenal | >45 | >14 |
Windspeed from waveclimate.com can be expressed in knots or in m/s. The next table shows the relation between windspeed values and the Beaufort scale.
| Beaufort | Wind speed (kn) | Wind speed (m/s) | |||
|---|---|---|---|---|---|
| 0 |
|
Calm | 0 - 1 | 0.0 - 0.52 | Sea like a mirror |
| 1 |
|
Light Airs | 1 - 3 | 0.52 - 1.80 | Ripples with the appearance of scales are formed, but without foam crests |
| 2 |
|
Light Breeze |
4 - 6 | 1.80 - 3.35 |
Small wavelets, short but pronounced
Crests have a glossy appearance, but do not break |
| 3 |
|
Gentle Breeze |
7 - 10 | 3.35 - 5.41 |
Large wavelets, crests begin to break
Foam of glossy appearance Perhaps scattered white horses |
| 4 |
|
Moderate Breeze |
11 - 16 | 5.41 - 8.50 |
Small waves, becoming longer
Fairly frequent white horses |
| 5 |
|
Fresh Breeze |
17 - 2 | 8.50 - 10.7 |
Moderate waves, taking a more pronounced long
form
Many white horses are formed Chance of some spray |
| 6 |
|
Strong Breeze |
22 - 27 | 10.7 - 14.16 |
Large waves begin to form
The white foam crests are more extensive everywhere. Probably some spray. |
| 7 |
|
Near Gale |
28 - 33 | 14.16 - 17.25 |
Sea keeps up and white foam from breaking
waves begins to be blown in streaks along the direction
of the wind.
Spindrift begins to be seen. |
| 8 |
|
Gale | 34 - 40 | 17.25 - 20.86 |
Moderately high waves of greater length
Edges of crests break into spindrift The foam is blown in well marked streaks along the direction of the wind Spray affects visibility |
| 9 |
|
Strong Gale |
41 - 47 | 20.86 - 24.46 |
High waves
Dense streaks of foam along the direction of the wind Sea begins to roll Visibility affected |
| 10 |
|
Storm | 48 - 55 | 24.46 - 28.58 |
Very high waves with long overhanging crests.
The resulting foam is in great patches and is blown in dense white streaks along the direction of the wind On the whole of the surface the sea takes a white appearance The rolling of the sea becomes heavy and shock-like Visibility is affected |
| 11 |
|
Violent Storm |
56 - 63 | 28.58 - 32.70 |
Exceptionally high waves
Sea completely covered with long white patches of foam lying in direction of wind Everywhere edges of wave crests are blown into fret Visibility affected |
| 12 |
|
Hurricane | > 64 | > 32.70 |
Air filled with foam and spray Sea white with driving spray Visibility very seriously affected. |
For the special case of the Pierson-Moskovitz spectrum, commonly used to represent a fully developed wind-sea, the relationship between waveclimate.com's mean wave period (Tm-10) and the peak period (Tp) reads:
Tp = 1.17 *Tm-10