Histogram
A histogram result page shows two tables and one plot.
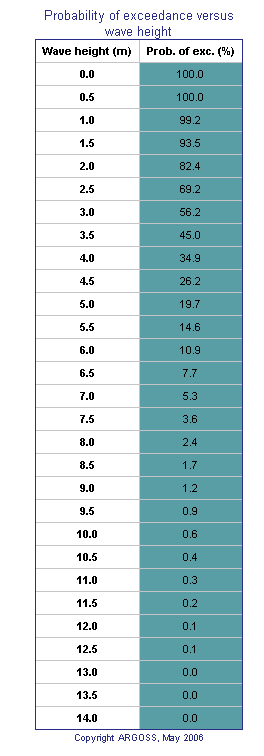
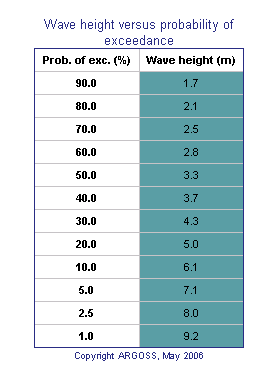
The leftmost table lists quantiles of wave height, wave period or wind speed in the first column versus the corresponding probability of exceedance in the second column. Step sizes are fixed to 0.5m, 1 s and 2 m/s or knots for wave height, wave period and wind speed respectively. The second table gives exceedance values (second column) against a fixed set of probabilities (first column).
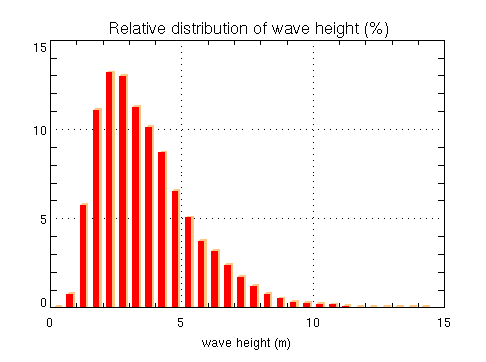
The histogram plot shows the relative distribution of wave height, wave period or wind speed per class. At each class center, a colored bar indicates the percentage of samples found inside that class. Class widths are fixed to 0.5m, 1 s and 2 m/s or knots for wave height, wave period and wind speed respectively.
Tip:
Logon as demo (no password needed) to get acquainted with the different types of output without being charged.