Fractile estimate
A fractile estimate, also known as threshold sensistivity plot, shows the fractile that is exceeded during a fixed fraction of time as a function of the threshold. It can help to find the appropriate threshold for curve fitting.
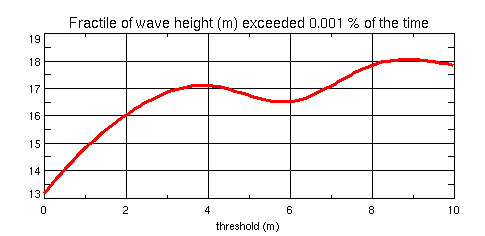
The example above shows the sensitivity of an exceedance value of significant wave height to the choice of a threshold. The threshold varies along the horizontal axis. Here we fixed the fraction of time to 0.001%.
Two additional quantities that depend on the threshold are shown: the Weibull shape parameter and the number of samples above the threshold.

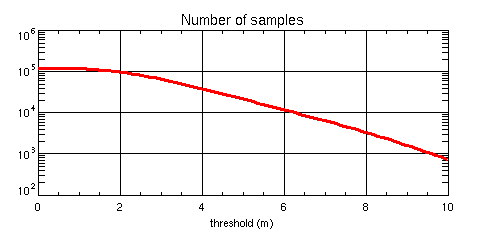
The Weibull shape parameter will of course be constant in case you selected a particular value for it .
Tip:
Refer to the
related FAQ on how to choose the input parameters for extreme value analysis.
Tip:
Background and guidelines for extreme value analysis
are also available as Word document.
Tip:
Logon as demo (no password needed) to get acquainted with the different types of output without being charged.