Fitted curve
A fitted curve shows the exceedance value of wave height or wind speed as function of the fraction of time it is exceeded. These values are based on an extrapolation of Weibull curve that was fitted to the data above a given threshold.
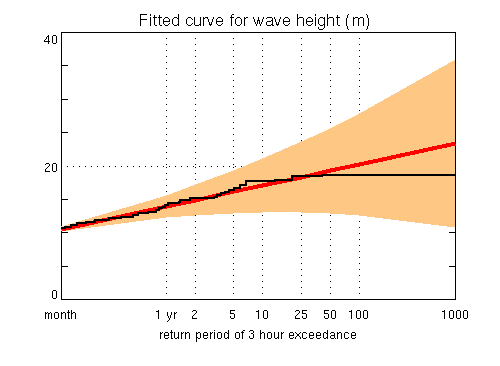
The fitted curve above shows wave height versus the fraction of time that it is exceeded. By default, the fraction of time is expressed as the return period of 3 hours of exceedance. This means that we assume a typical storm duration of 3 hours. We also assume that if the waves exceed a certain extreme value, they will do so during the whole storm or interval. Depending on the area of interest, you might prefer an average storm length of 6 or even 12 hours. The red line is the fitted curve and indicates the average exceedance value (or fractile). The area shaded orange indicates the 90% confidence interval of the exceedance value. From a standard set of fractions, only the fractions which are smaller than the fraction of the data exceeding the threshold are used for the plot. Apart from the fitted curve, the plot shows the sample distribution (stepped solid black line). Stepsize used for wave height is 0.25 m. Stepsize used for wind speed is 0.5 m/s or knots (depending on your preferences). From the plot above, you can see that the return period of a wave above 15 m, or better the return period of a storm with a duration of 3 hours in which a wave occurs higher than 15 m, is about 5 years. Now, one can determine the probability that a wave higher than 15 m will occur during longer periods of for instance 10, 100 or 1000 years.
A return period of 3 hours of exceedance of 5 years corresponds to a fraction of time of 3/(5*365*24)~0.00007.
For convenience, waveclimate.com also gives a table of exceedance from which you can read the exact values.

You can also choose to plot the fraction of time as such along the x-axis of the fitted curve:

The plot above shows that the fraction of time that waves exceed 15m
is indeed near 0.00007.
The corresponding table:

Tip:
Refer to the
related FAQ on how to choose the input parameters for extreme value analysis.
Tip:
Logon as demo (no password needed) to get acquainted with the different types of output without being charged.
Tip:
Use preferences to tailor the output to your needs (under Account in the upper right menu) .