Scatter table 2D
A 2D scatter table shows the relative joint occurrence of two parameters.
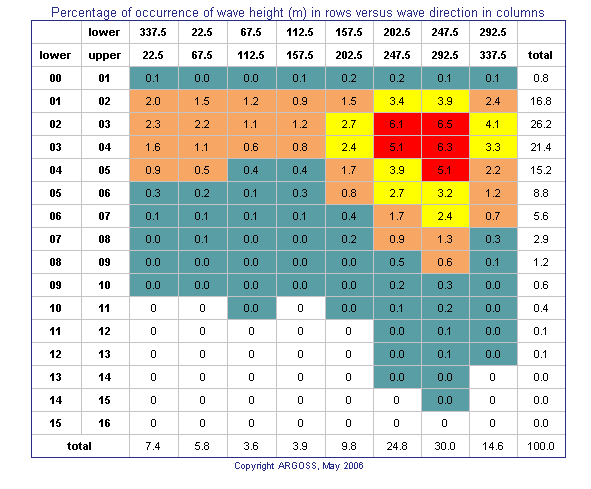
The 2D scatter table above shows the joint occurrence of wave height and wave direction. The first directional sector is centered around true north. The directional convention is nautical, i.e. 0 degrees means that waves are coming from the north and 90 degrees means that waves are travelling east-west. Each table entry contains the percentage or the absolute number of pairs of samples falling inside the related parameter classes. Colors indicate the 5 highest entries (red), the 10 highest of the rest (yellow) and the 25 highest of the rest of the rest (orange). White indicates 'real' zeros.
In a 2D scatter table, wave direction, wave period or wind direction can be undefined. For a wave spectrum with very little energy for example, wave height approaches zero and wave period and wave direction become undefined. Scatterometer wind directions are rarely defined for wind speeds below 3 m/s. These missing or undefined values are distributed over the lower wave height (or wind speed) classes in the following way. For all classes but the lowest, samples with undefined directions (or wave periods) are distributed equally over the directional sectors (or wave period classes), according to the number of defined directions (or wave periods) in a class. Samples with missing direction (or wave period) in the lowest wave height (or wind speed) class are distributed according to the distribution of the lowest but one wave height (or wind speed) class.
If you asked for 13 scatter tables at once, you will see a 2D scatter table for each month of the year preceeded by the all year 2D scatter table. Note that relative occurrences in each of these 2D tables add up to 100 percent.
Use the link above the table to download the results in a comma-separated text file for further processing.
For scatter tables of wind speed versus wind direction, waveclimate.com offers an extra output format: the so-called WASP format. WASP is a PC-program for the vertical and horizontal extrapolation of wind climate statistics. Waveclimate is able to export WASP files in two formats: the TAB format and the LIB format. Files in TAB or LIB format can be directly imported in the WASP package for further analysis. A WASP table in TAB format shows the relative joint occurrence of wind speed in rows versus wind direction in columns. Links to the downloadable WASP text files are inserted above the scatter table.
Tip:
Logon as demo (no password needed) to get acquainted with the different types of output without being charged.
Tip: Use preferences to tailor the output to your needs (under Account in the upper right menu) .