Time series plot
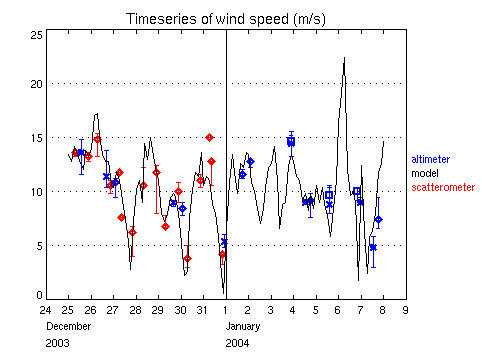
The time series plot shows the minimum values, the maximum values and the medians per satellite pass as well as the wave model output of the currently selected parameter. Available samples from different satellites and sensors are shown in the presented graph. Sample dates are within a week before and after the current event date. Satellite observations are picked from the data area under investigation. Wave model computations come from the currently selected output point. In general, satellite medians of significant waveheight will coincide with the wave model curve. On the other hand, variability of wave height observed by satellites will be greater than the variability of wave model computations. Also refer to the related FAQ.